Session Twelve: Validity, Reliability and Generalisability, Bias and Confounding Variables

This episode is a live recording of the eleventh session of #UnblindingResearch held in DREEAM 17th April 2019. The group work has been removed for the sake of brevity.

Here is the #TakeVisually for this episode:

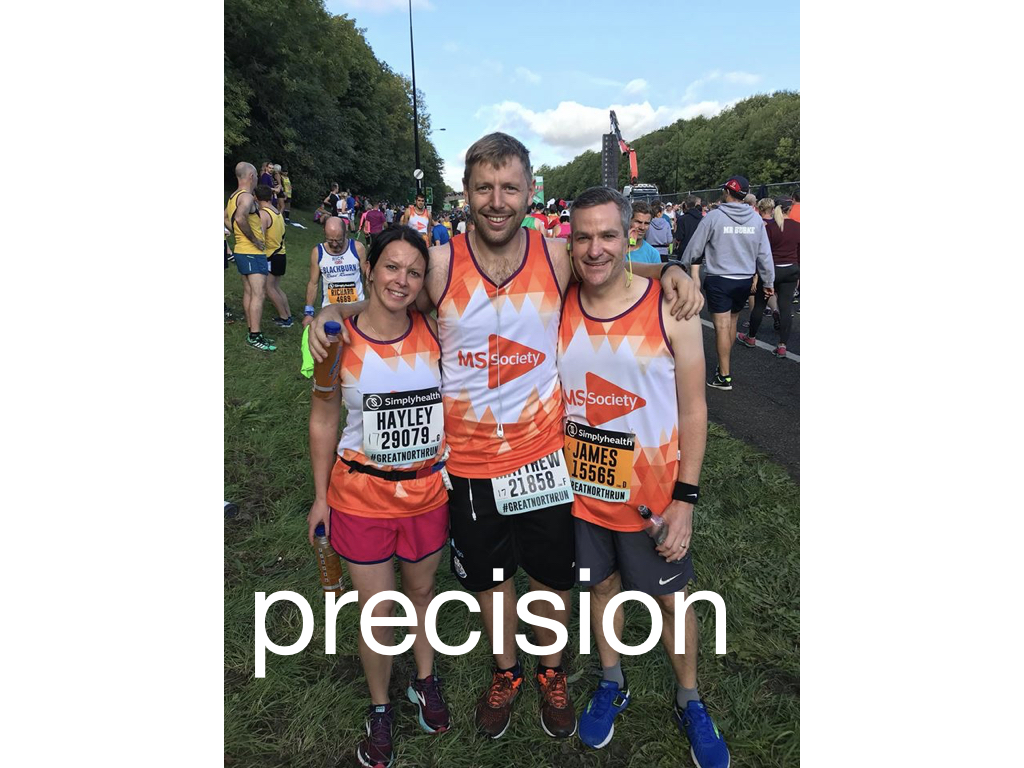
This session uses the example of DREEAM alumnus James Pratt who completed the Great North Run last year in 1 hour 39 minutes! This was used as a way of explaining some definitions.

Accuracy, Precision and Reliability

Accuracy describes how close a device’s measurement is to the true value. So when the stopwatch went off as James crossed the finish line the accuracy of the recorded time is how close it is the time he actually took running.

Precision and reliability are very similar.

Say James runs the Great North Run a few times and each time at the same speed. He’d get a series of finish times. Precision describes how close together those times are. If James runs the same race at a similar speed he would expect precise times.

In this session we asked the audience to draw two dots on the nose of a photo of our head of service whilst blindfolded to show the difference between accuracy and precision.

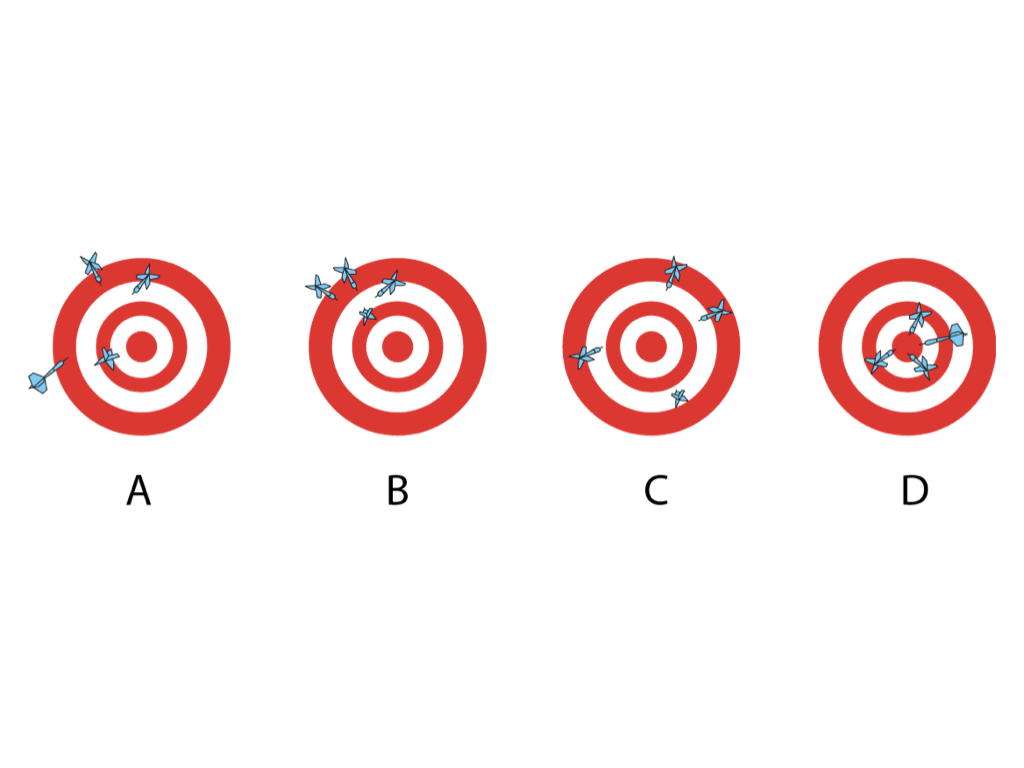
In Dartboard A the thrower has poor accuracy as there is variation between the distances of the darts from the bullseye and poor precision as the darts are not close togetherIn B the precision is good as the darts are close together but accuracy is …

In Dartboard A the thrower has poor accuracy as there is variation between the distances of the darts from the bullseye and poor precision as the darts are not close together

In B the precision is good as the darts are close together but accuracy is poor

In C the accuracy is good as the darts are of a similar distance from the bullseye but precision is poor

In D the darts are both accurate and precise

Taken from https://manoa.hawaii.edu/exploringourfluidearth/physical/world-ocean/map-distortion/practices-science-precision-vs-accuracy

On the other hand reliability describes whether the race and stopwatch themselves produce consistent results given similar conditions. So if James runs the Great North Run at the same speed he will get consistent times if the race is being measured reliably.

There are many different types of reliability. If James runs the race twice at the same speed he’d want the same outcome. This is test-retest reliability. If James runs the race several times and each time a different person is timing him he’d want them to be measuring to the same accuracy. This is inter-rater reliability.

In our session we asked two of our audience members to draw our head of service as a demonstration of the importance of reliability.

Validity and Generalisability

A study’s internal validity reflects the author’s and reviewer’s confidence that bias has been minimised and eliminated.  Evaluating the study methodology for sources of bias allows us to assess the study’s internal validity.  The highest validity studies often are those looking at a specific intervention in ideal circumstances.  As a result high internal validity often comes at the cost of generalisability.    Levels of evidence are based on how high the internal validity is. 

The key question to ask when thinking about external validity or generalisability is ‘what are the differences between the source population (the population from which the study population originated) and the study population (those included in the study)?  A generalisable study is one where the findings can be applied to other groups or populations.  Loose inclusion criteria are often used in studies with high external validity but this may compromise the external validity. 

The ideal scenario would a study with randomised patients and blinded researchers collecting and analysing the date (high internal validity) and using minimal exclusion criteria so the source and study populations are closely related (high external validity). 

There are objective models to quantify both external and internal validity.  Randomised control trials must be rigorously evaluated.  The CONSORT statement provides a concise 22-point checklist for authors reporting the results of RCTs.  Conforming to the CONSORT checklist provides adequate information for anyone reading the study to understand its methodology. 

Fragility Index

In a previous session we talked about levels of evidence and significance.  Fragility Index looks at how many events would need to change for the p value to go >0.05 (how many events need to change for the outcome to no long be significant).  The lower the Fragility Index the more fragile the study is.  This is important because a lot of clinical trials actually turn out to be very fragile. 

A Fragility Index calculator is available at http://www.fragilityindex.com/

Say you’ve studied 100 people on new treatment vs 100 on the old treatment

Intervention mortality was 7 whilst control mortality was 20

Using the above calculator we find we’d only need 3 events to change for our trial to no longer be significant

More on fragility index can be found at https://lifeinthefastlane.com/ccc/fragility-index

Bias

Bias is any tendency which prevents unprejudiced consideration of a question.  Evidence based medicine (EBM) arose in the early 1980s as a way of making Medicine more data-driven and literature based.  It is important to consider bias throughout the research process; before, during and after the trial.  While random error decreases as our sample increases bias is independent of both sample size and statistical significance. 

Pre-trial bias is created by errors in our study design and the recruitment of patients.  Think about how standardised the measurements are – if there is an interview or questionnaire is everyone on your research team going to use it in the same way?  Blinding is not always possible – in surgical studies for example – so you could have different people assessing the outcome than those who assessed the exposure.  Different parts of the team can be blinded.  Selection bias is particularly risky in case-control and retrospective cohort studies where the outcome is already known as the criteria for inclusion in different groups might be radically different.  Prospective studies, especially randomised-control trials, are less prone to selection bias.  Channelling bias can be seen when a subject’s health or prognostic factors dictates the cohort they are placed in.  We might see this in a surgical study when younger, healthier patients are placed in the surgery cohort while older, less healthy patients aren’t. 

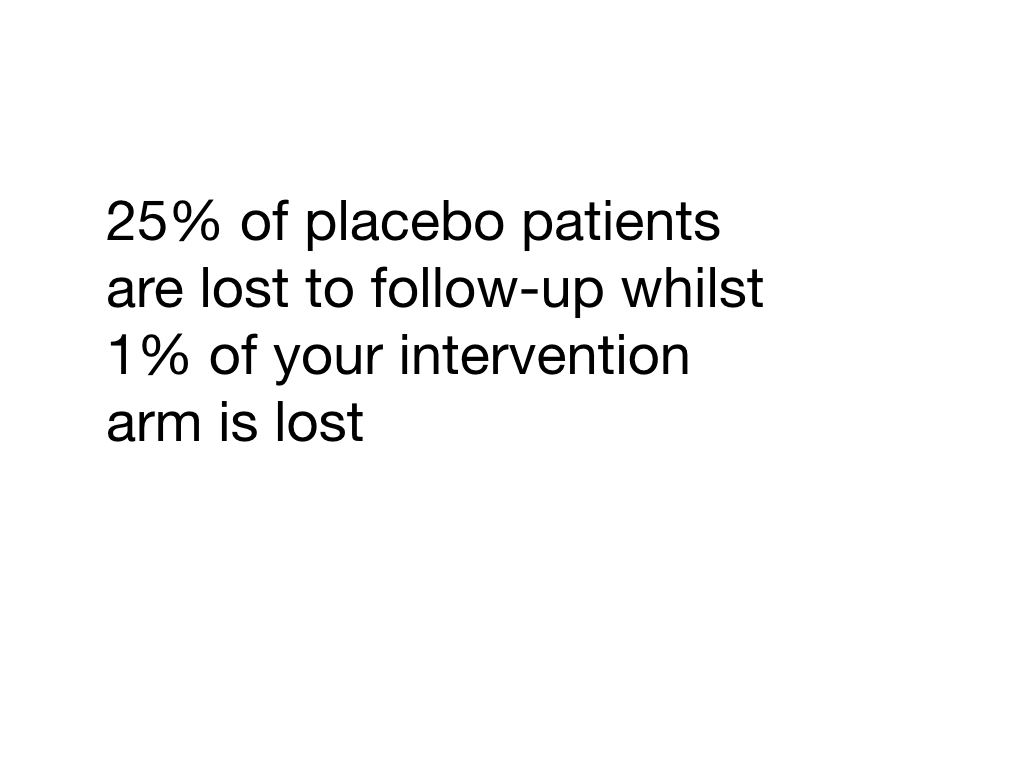
Information bias is a blanket term for bias occurring in the measurement of an exposure or outcome and can occur throughout the data collection process.  Data collection can change depending on who is collecting it (interviewer bias).  Historic controls could be used (chronology bias) or there could be problems recalling information or memory may cloud recollection (recall bias).  Patients can be lost to follow-up and so lost from the study.  These individuals may be fundamentally different to those retained in the study (transfer bias).  There may be problems defining the exposure or properly identifying the outcome (misclassification of exposure/outcome).  If a process (say surgery) has a lot of variation technically or in terms of seniority/experience this may affect the outcome (performance bias). 

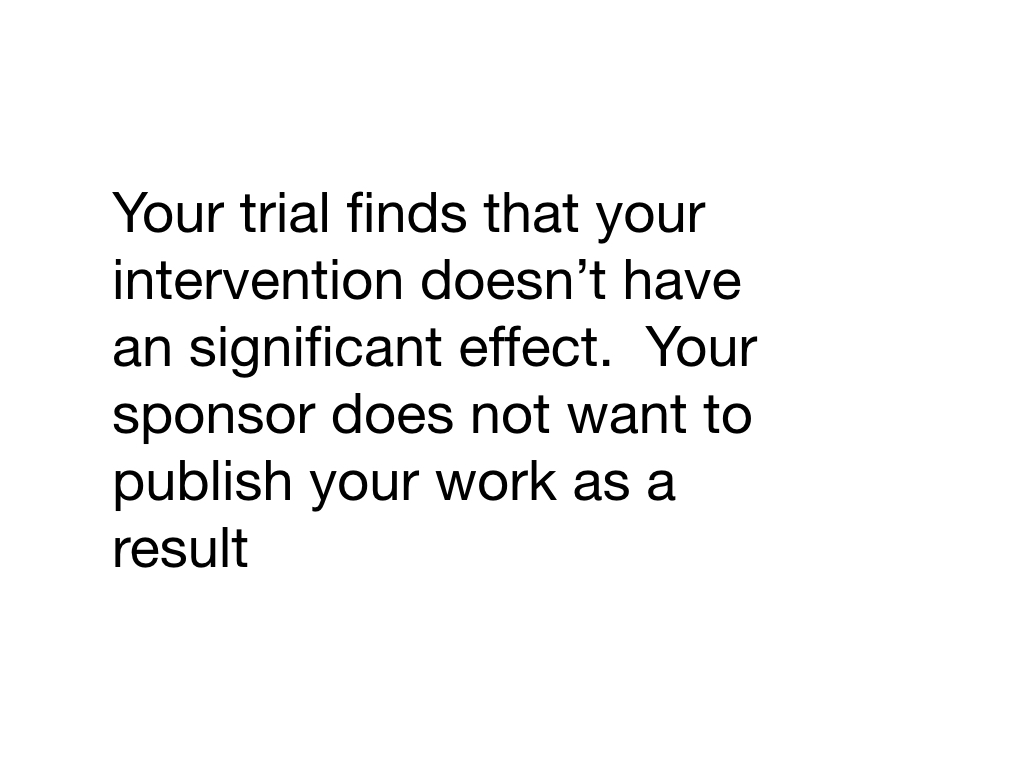
Bias after a trial is concluded occurs during data analysis or publication.  There’s the desire to only publish positive or favourable outcomes (citation bias).  There could be a third factor, often associated with our outcome of interest and the exposure, which affects the observed association.  This is called confounding.  Say you studied coffee drinking and lung cancer and found that those who drank more coffee had higher rates of lung cancer.  A confounding variable would be smoking (people having a cigarette with their coffee).  You’d have to appreciate this when you design your trial.  
Session Eleven: Medication Trials

This episode is a live recording of the eleventh session of #UnblindingResearch held in DREEAM 16th January 2019. The group work has been removed for the sake of brevity.

This session of #UnblindingResearch looks at the phases of medication trials, the placebo effect and how medicines and medical devices are kept safe.  Here are the slides for this session (p cubed of course), you can move between slides by clicking on the side of the picture or using the arrow keys.

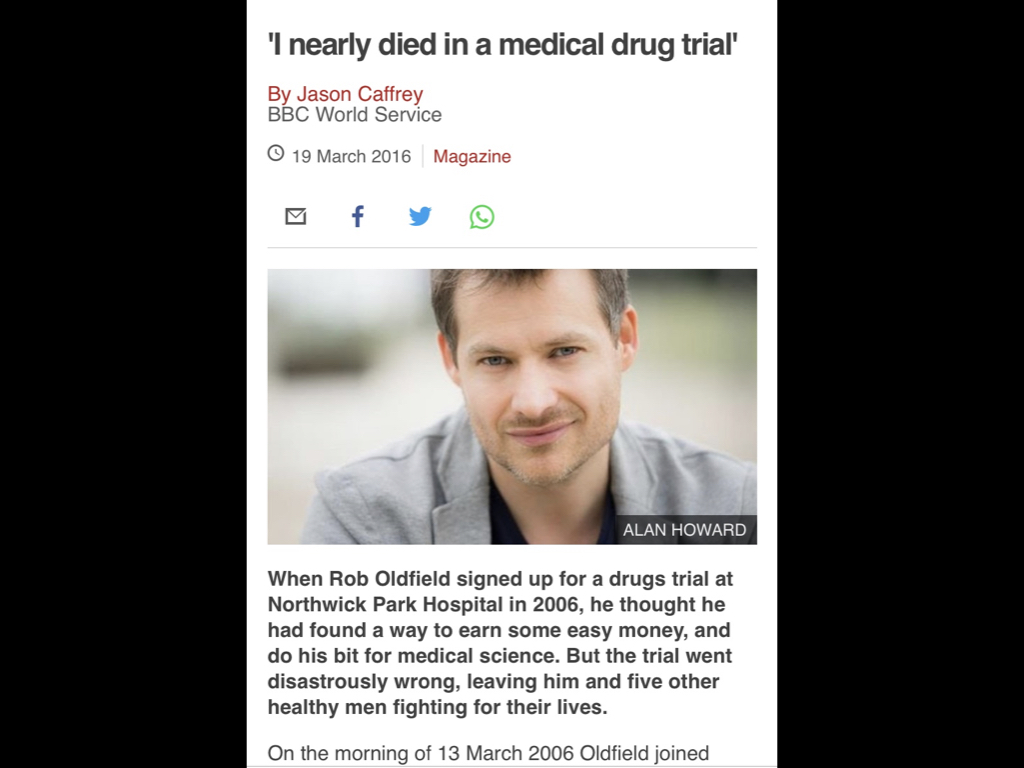
Obviously we want to make sure that any medication we give our patients is safe to use. This means we need to trial any possible new drug before it gets a licence for use. However we have to make sure that any trial is conducted in as safe and methodical a way as possible.

The Placebo Effect

As discussed in previous sessions no trial is ever perfect and there is always a chance that any observed effect is due to chance alone. Another issue we face in any clinical trial is the placebo effect. Placebo is Latin for ‘I will please’ and the placebo effect is a well recognised effect in Medicine as this article in Nature from September 2018 demonstrates. In medical trials a placebo is any intervention which is known not to have any therapeutic value (such as a sugar pill.) As discussed in previous sessions placebos are very often used in randomised control trials as a comparison against a potential new treatment. Often the patient is blinded as to whether they have had the new intervention or a placebo. Any measured response to the placebo is called the placebo response. The difference between the response to placebo and the response to no intervention is the placebo effect.

The Phases of Medication Trials

The first stage of any medication trial will begin with a review of previous literature before non-human studies investigating the pharmacokinetics and safety of the potential new drug. This is the pre-clinical stage. There then may be a small study in human subjects using very small doses of the drug to investigate the pharmacokinetics in humans. This step is known as ‘Phase 0’ and very often doesn’t actually take place.

Phase I

Phase I involves a small study in human volunteers and is interested in drug safety. Low but ascending doses of the drug are given to the volunteers. This gives us an idea of dose ranging and any potential side effects or toxicity. Phase I will involve healthy volunteers usually but for cancer drugs may involve patients with cancer.

Phase II

If a drug passes Phase I we’re now interested in whether the drug has a therapeutic effect in ideal conditions. This is known as the drug’s efficacy. Phase II may be divided into two: Phase IIa and IIb. Phase IIa is interested in looking at whether the drug shows therapeutic effect in ideal conditions (such as whether a potential new tumour drug actually shrinks tumour cells.) IIb looks at finding an optimum dose range for the drug in ideal conditions balancing therapeutic effect with side effect/toxicity profile. Volunteers will have the specific disease we are interested in and we’ll usually recruit a few hundred.

Phase III

If the drug gets through Phase II we’re now interested in how it works in real life conditions such as those a patient will encounter. This is known as the drug’s effectiveness. Phase III will involve a larger sample of volunteers with a specific disease up to a few thousand in number.

Phase IV

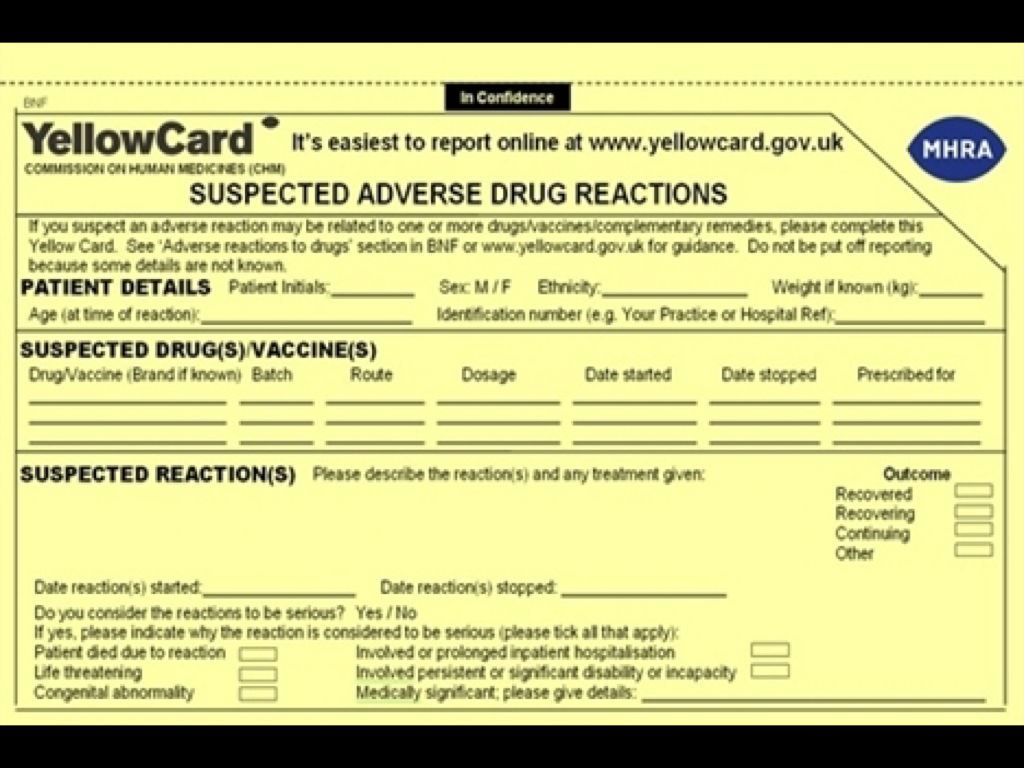
By this point the drug has been proven to work and be safe and has been approved for use and so granted a licence. Phase IV trials involve looking at the long-term effects of the drug and more about its side effect profile. There is no limit to Phase IV as the drug is being used in the wide community. The Medicines and Healthcare products Regulatory Agency (MHRA) is an executive agency of the Department of Health and Social Care which is responsible for ensuring the safety of medicines and medical devices. The Yellow Card Scheme (available as a smartphone application) collects data related to safety. This includes suspected adverse drug reactions and defective or counterfeit medications.

Cancer Research UK have a really good page on the phases of clinical trials here.


Here is the #TakeVisually for this episode:

Remember the next session:

Validity, Reliability and Generalisability, Bias and Confounding Variables, 20th February 2019

Session Nine: Randomisation

This episode is a live recording of the ninth session of #UnblindingResearch held in DREEAM 21st November 2018. The group work has been removed for the sake of brevity.

This session of #UnblindingResearch looks at randomisation and the different techniques for overcoming selection bias.  Here are the slides for this session (p cubed of course), you can move between slides by clicking on the side of the picture or using the arrow keys.

Here is the #TakeVisually for this session:

Which trials use randomisation and why?

Randomised controlled trials (RCT) are used to test a new treatment against the current standard or between two or more existing treatments to see which works best. They consist of at least two groups; one who receives the new treatment and a control group who receive the current treatment or placebo. Randomisation is used to overcome selection bias. Essentially it means that a participant’s allocation is not prejudiced. Biased allocation can effect the outcomes of a trial. Say you only recruited fit younger participants to receive your new treatment and older, unwell patients received placebo then it’s more likely your trial will find your drug works. A compromised randomisation study is actually worse than an explicitly unrandomised study as at least the latter has to be open about its lack of randomisation and what potential biases it might have. Randomisation must make sure that each group of participants in the trial are as similar as possible apart from their treatment allocation. This means that whatever differences in outcomes are seen are due to the treatment received.

Simple randomisation

Simple randomisation is allocation based on a single sequence of random assignments such as tossing a coin. Other random events such as picking a card or rolling a dice can be used. Random number generators are another type of simple randomisation. Simple randomisation works well in large groups of subjects and is easy to use. However, in smaller groups it is more likely to produce unequal group sizes and so could be problematic.

Stratified randomisation

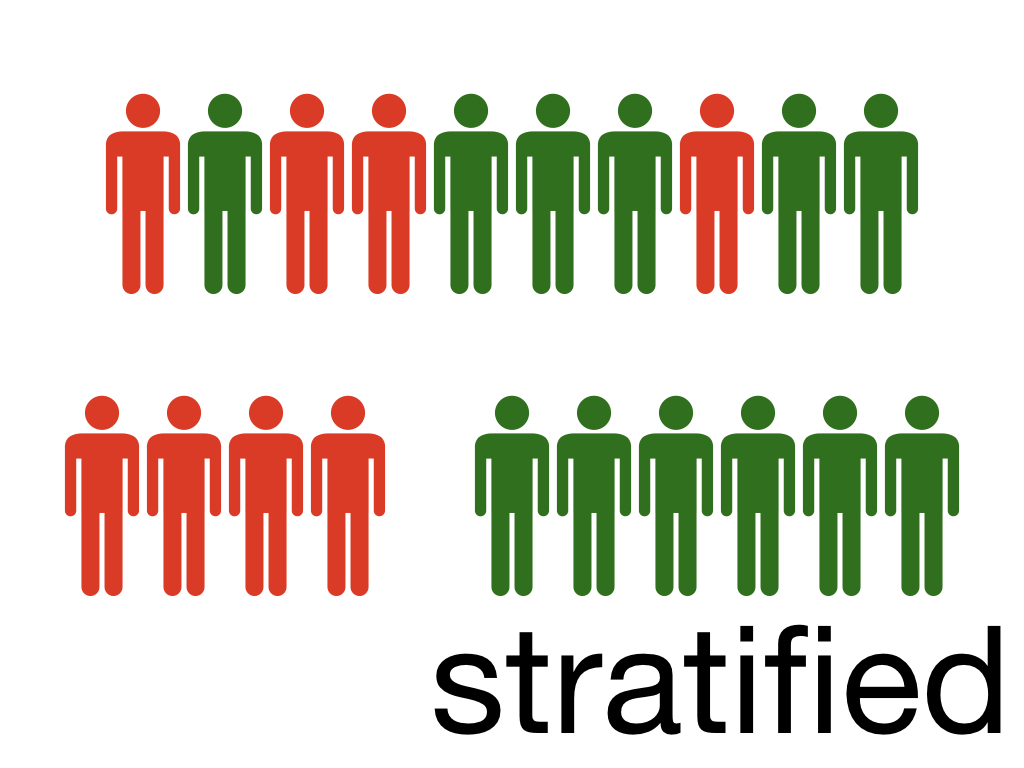
Stratified randomisation is used if you’ve identified baseline characteristics (co-variates) which might affect your trial outcome. For example you may be studying a new intervention to shorten post-operative rehabilitation. The age of your participants is going to influence rehabilitation anyway. You might therefore perform stratified randomisation; first sorting the patients into age blocks before then performing simple randomisation into either intervention or placebo. This is more difficult for larger sample sizes and ideally should be performed right at the beginning of the trial with all participants signed up and their characteristics known. However, in practice subjects are usually recruited and randomised one at a time and so performing stratified randomisation would be very difficult.

Randomisation Pics.008.jpeg

Cluster randomisation

Clustered randomisation involves randomising groups (clusters) of participants to receive either control or intervention. This technique isn’t used in drug interventions but instead is used for interventions involving a large group such as an education programme which is delivered to the intervention group but not the control group. You can imagine it wouldn’t be feasible to deliver an educational programme to a hundred people individually but would be to one group at a time. Each cluster should be representative of the overall population. As a cluster gets bigger the power and precision of the study goes down. The intracluster correlation coefficient (ICC) measures the degree to which observations from the participants in a cluster are correlated. It is measured from 0-1. The higher the ICC the more close the values from a cluster are. The lower the ICC the the more difference there is between values from the same cluster.

1:1, 1:2, 1:3 randomisation

Classic randomisation is 1:1 (ie one participant to one group, one to another) but sometimes randomisation is unequal and can be 1:2 or 1:3. There are a number of reasons for this. One is cost; if one arm of the trial is cheaper then the other it can make sense to recruit more to the cheaper arm, this is rare though. Much more likely is if you are trying to assess the safety or efficacy of different dosing regimes. Some trials may involve a new technique with a learning curve for the practitioner (say new equipment for a doctor to use). If you recruit more to the intervention arm you’d overcome this learning curve effect on your trial. In some trials you may anticipate high drop out and so aim to mediate this with unequal randomisation. This doesn’t affect intention to treat (ITT) analysis. You may be worried about recruitment and believe that if a participant has a 3x increased chance of being in the intervention arm than placebo you may want a 1:3 randomisation. However, if you’re really worried about how much benefit the new treatment is against your control you should really look at changing your trial. This is the principle of equipoise. Unequal randomisation affects sample size. For the same power as a 1:1 trail a 1:2 trials needs 12% more participants and a 1:3 needs 33% more.
Block randomisation

Block randomisation on the other hand aims to ensure equal participants to each group. Say you have two trial arms A and B. If you used blocks of 4 to recruit it might look like this:

Block 1: ABAB

Block 2: BAAB

Block 3: ABBA and so on

Randomisation Pics.007.jpeg

Notice after every block of four two participants have gone to A and two to B. This ensures equal recruitment.

Next box, sealed envelope, telephone/web randomisation

With sealed envelope randomisation each research team is given a selection of envelopes which contain the allocation. After recruitment the envelope is opened and that allocation offered to the patient. This is open to compromise however, the envelope could be tampered with and even made transparent if held up against the light!

Another option is distance randomisation, either over the telephone or a website. This uses a third party service, of which there are many, who logs the patient details and then allocates the participant.

The research team may use next box on the shelf recruitment. You’re provided with a selection of boxes and you literally pick the next box on the shelf each time you recruit. Each box will have a separate code which you’ll log but otherwise you won’t know if you were giving a placebo or the intervention.

Our next session is on 19th December and is on Blinding

Untitled.001.jpeg

Session Seven: Sampling

This episode is a live recording of the seventh session of #UnblindingResearch held in DREEAM 19th September 2018. The group work has been removed for the sake of brevity.

This session of #UnblindingResearch looks at the factors that decide the sample size of our study.  Here are the slides for this session (p cubed of course), you can move between slides by clicking on the side of the picture or using the arrow keys.

Here is the #TakeVisually for this session:

A population is the whole set of people in a certain area (say Britons).  It is impossible to study a whole population so we have to use sampling.  The 'target population' is the subset of the population we are interested in (such as Britons with hypertension).  The sample is a further subset of the target population that we use as representative of the whole.  

Generally every member of the population you are interested in should have an equal chance of being in the sample.  Once an individual is included in the sample their presence shouldn't influence whether or not another individual is included.  

If our sample is too small we risk the study not being generalisable.  If the sample is too big we risk wasting time, resources and exposing more participants to potential harm.  So we have to get the right size through calculation.  

For this session we looked at one population - Gummi Bears. 

gummi-bears-8551_960_720.png

Just as with a human population Gummi Bears show variation across individuals.  This could influence any study involving Gummi Bears.  For the sake of this sessions we used a made up condition 'Red Gummi Fever' - a condition which makes Gummi Bears go red.  We then thought about studying a potential cure.  At the beginning we'd create a null hypothesis - that our new treatment would not cure Red Gummi Fever.  As we make our null hypothesis we have to mindful of Type I error and Type II error

  • Type I error (false positive) - we falsely reject the null hypothesis (i.e. we say our cure works when it doesn't)

  • Type II error (false negative) - we falsely accept our null hypothesis (i.e. we say our cure doesn't work when it does)

Generalisability (or external validity) is the extent to which the findings of a study could be used in other settings.  Internal validity is the extent to which a study accurately shows the state of play in the setting where it was held.  

gummibarchen-359951_960_720.jpg

We also have to think about the condition itself and in particular its incidence and prevalence.  

Incidence is the probability of occurrence of a particular condition in a population within a specified period of time.  It is calculated by:

(Number of new cases in a particular period of time/Number of the population at risk of the event) - often expressed as number of events per 1000 or 10000 population 

Prevalence is the number of cases of that disease in a particular population in a given time. It is calculated by:

(Number of cases in a population/total number of individuals in the population) - often expressed as a percentage but may be per 1000 or 10000 population for rarer conditions

So if we say we have a population of 1000 Gummi bears.  300 of them are red currently.  Each year 50 bears catch red bear fever.  

Our incidence is 50 events per 1000 population.

Our prevalence is 3%.  

p value.png

Back to our Type I and Type II Errors.  When working out our sample size it is important that we have just the right amount of participants to overcome these errors.  

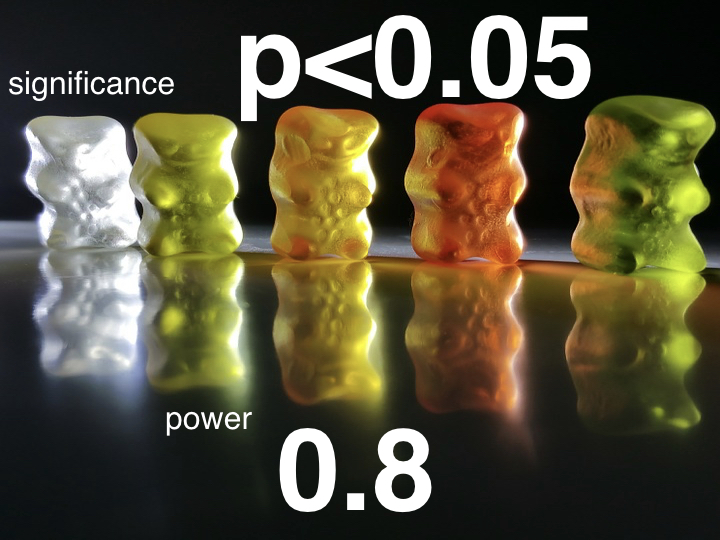
Significance is concerned with Type I Error.  We ask ourselves the question "could the effect I've seen have occurred at random?"  It is expressed with a p value.  A p value of 0.05 means that there is a 5% chance of the study outcome have occurring at random.  The gold standard is a p value <0.05.  So when we are working out our sample size for our treatment for red bear fever we want it to be able to have a p value <0.05 so if our study finds that our treatment works we can say there is a less than 5% chance that our finding was down to chance alone.  A p value >0.05 is not deemed significant.

When thinking about significance a test can be one or two tailed. This is all to do about what we are hoping to show.

For example, you might have developed a new drug to treat hypertension. You would trial it against the current standard of hypertensive treatment. If you were only interested in a non-inferior outcome (i.e. you just want to show your new drug isn’t worse than the current gold standard) then you’d only need a one tailed test. Your p value would be totally allotted to that one outcome. If you wanted to show that your new drug is both better and not worse (a superior and non-inferior) outcome then you would need a two tail test. Half of your p value would be allotted to the non-inferior outcome and half to your superior outcome.

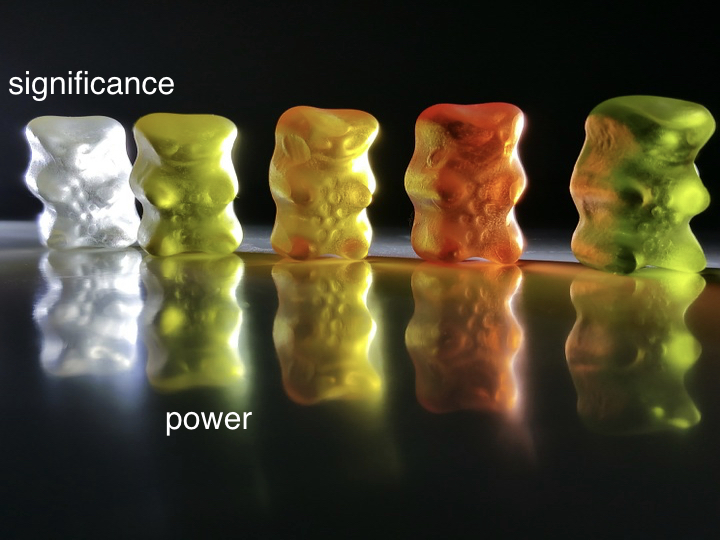
Power is concerned with Type II Error.  Here we ask ourselves "what is the chance of us falsely finding a negative outcome?"  This is expressed as a decimal.  Power of 0.8 (or 80%) means there is a 20% chance (or 1/5) of a falsely negative result being found.  0.8 is the usual gold standard while some larger/pivotal studies will want a power of 0.9.  

5 bears.png

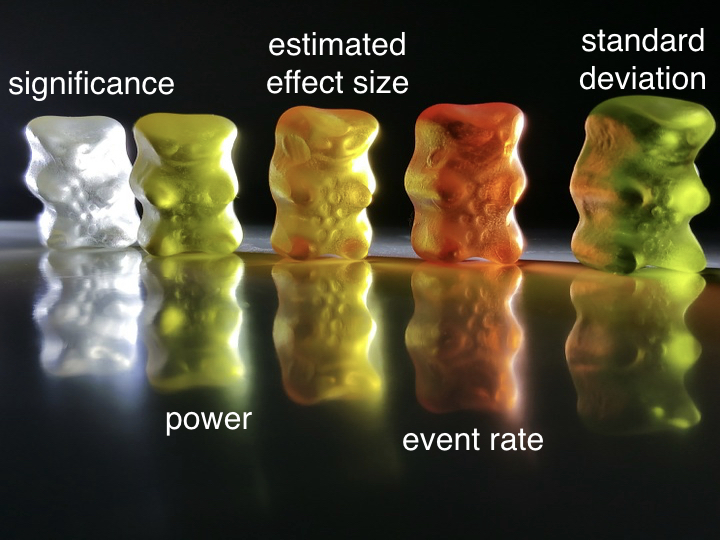
What we then have to consider are estimated effect size, the event rate and the standard deviation of our population.

Estimated effect size = Effect size this is essentially what we want our treatment to do.  This is calculated by the control variable minus the test variable.  This could be a reduction in mortality, in blood pressure etc.  Estimated effect size is based on previously reported or pre-clinical studies.  The larger the effect size in previous groups the smaller our sample needs to be.  The smaller our effect size the larger the sample needs to be.

The underlying event rate or prevalence.  We take this from previous studies.  

We finally need to know how varied our population is.  Standard deviation is a measure of the variability of the data.  The more homogenous our population the smaller the variation and so the smaller the standard deviation means our sample size needs to be smaller.  

Sampling.010.jpeg

The calculations to work out a sample size are quite complicated so luckily there is software and several websites we can use to help us.  This link goes to one such example at ClinCalc which shows everything we've talked about here quite nicely.

Here are a couple of papers which go through sample sizes:

Kaden and Bhalero (2010)

Gupta et al (2016)

While we’re still thinking about power and significance it’s worth thinking about fragility index. Fragility Index looks at how many events would need to change for the p value to go >0.05 (how many events need to change for the outcome to no long be significant).  The lower the Fragility Index the more fragile the study is.  This is important because a lot of clinical trials actually turn out to be very fragile. 

A Fragility Index calculator is available here

Say you’ve studied 100 people on new treatment vs 100 on the old treatment

Intervention mortality was 7 whilst control mortality was 20

Using the above calculator we find we’d only need 3 events to change for our trial to no longer be significant

More on fragility index here

Sampling.013.jpeg

Session Six: Qualitative vs Quantitative

This episode is a live recording of the sixth session of #UnblindingResearch held in DREEAM 15th August 2018. The group work has been removed for the sake of brevity.

This session of #UnblindingResearch looks at the fundamental distinction in research between two types of data: qualitative and quantitative. Here are the slides for this session (p cubed of course), you can move between slides by clicking on the side of the picture or using the arrow keys.

Here's our Take Visually for this session:

This session started by discussing the main distinctions between the two once again with a sweet analogy.  We also had a think about how the two different types of research collect, analyse and report the data.

Adapted from Minchiello et al (1990, p.5)

Then, through some group work and more discussion this session looked at the strengths, weaknesses, trial design and the role of the investigator when it comes to qualitative vs quantitative.

Qualitative

Qualitative data is any data not in the form of numbers so will include words, images or objects.  Qualitative research looks to interpret events in their natural settings and to make sense or interpret phenomena in terms of the meanings people bring to them.  In terms of social science there has been a big debate (positivism vs anti-positivism) about the correct approach to take with social phenomena.  The groups will be smaller and not randomly selected.  Variables are not studied because the study is interested in the whole experience.  

The study will be through interviews or focus groups, open ended responses or observations and/or reflections.  The researcher will then assess the data or patterns, themes or features.  The focus is wide and examines the breadth and depth of the topic in question.  Findings are more generalised and due to the nature of the data reliability and validity are difficult to measure.  The studies are often time heavy and it may require sub-specialism to correctly analyse the data.  The researcher is often closely involved with the subjects and their environment and so can appreciate a fuller view of the issues involved.  Qualitative data can suggest possible relationships or cause/effects and reveal subtleties hidden from quantitative research.  

Quantitative

Quantitative data is numerical, in units of measurement or in categories or in sequence.  

Quantitative research looks to test hypotheses, causality and make predictions.  Samples will be bigger and randomly allocated with specific variables studied.  Numbers and statistics will be collected through measuring with structured and validated instruments.  The goal is to identify statistical relationships in a narrow, specific topic.  That means the findings are more projectable across the population base.  

Smaller quantitative studies are more likely to be less reliable and so large samples are needed which may be difficult to achieve.  The research is remote from the setting and may not have sufficient background to analyse the results or place them in a social context.  However, modern software does mean analysis can be performed increasingly easily and the nature of the data and analysis makes it easier for others to appraise your work.  

Remember the next session:

Sampling 19th September 2018

Session Five: How are clinical guidelines produced?

This episode is a live recording of the fifth session of #UnblindingResearch held in DREEAM 27th June 2018.  The group work has been removed for the sake of brevity.

This session of #UnblindingResearch looks at the different levels of evidence and how our clinical guidelines are produced using them.  Here are the slides for this session (p cubed of course), you can move between slides by clicking on the side of the picture or using the arrow keys.

Here's our Take Visually for this session:

There are levels of research evidence usually represented in a pyramid.  The higher up the pyramid the greater the evidence base, through the use of controls, randomisation and greater statistical analysis.  The higher up the pyramid the harder and more expensive the study is to perform and so there are fewer examples of the study in question.  The session contained an exercise to sort fictitious examples of research into order of evidence from lowest to highest.  These are the examples in the right order:

  • We present an article written by the RCN President who argues that research nurses should be given free sweets as a sign of good will which will undoubtedly cause their recruitment to studies to go up.

(Opinion)

  • We report the case of a research nurse who after being given 3 wine gums a day as well as their normal lunch had increased their recruitment to studies by 24%.

(Case report). Case reports can help identify new trends or diseases such as the MMWR in June 1981 which first described what would become  known as AIDS.  They also serve an educational purpose.  However, they are not generalisable and may focus on the rare and not actually that useful.

  • We present our study into access to sweets and research nurse retainment.  10 research nurses began working at our research department in May 2017.  They each received a free bag of wine gums on arrival.  By May 2018 6 of the nurses remained in post.  

(Case series)  Case series look at participants with a known exposure.  They have no comparison.  

  • We report our study into access to sweets and research nurse retainment.  We compared research nurses who left their post within a year to those who have remained in post after a year.  We found that the nurses who remained in post ate on average 1 packet of wine gums more a week than nurses who left their post.

(Case-control)  These compare participants with a known outcome with those who do not have that outcome.  It looks back to see the relationship between a risk factor or exposure and that outcome. As we know the outcome has occurred these are quicker and are useful for initial studies and rare diseases.  As they are retrospective they are susceptible to recall bias and are not good for diagnostic tests because we know the outcomes already.

  • We report our study into research nurse intake of sweets.  We compared a group of research nurses to a group of educator nurses and a group of staff nurses.  We found that research nurses eat on average 3.4 sweets more each than educator nurses and 1.2 more than staff nurses.     

(Cohort study) A study where one or more samples (cohort) are compared prospectively to assess the effects of certain factors on a particular outcome.  Participants in a group can be matched with a subject in another group with similar demographics so as to limit variables.  Cohort studies are easier to carry out than randomised control trials.  However, there is no randomisation, they may take a lot of time and are susceptible to confounding factors.

  • We present our study into sweets and research nurse recruitment to studies.  We compared Maynard wine gum to an identical tasting placebo.  We randomly allocated 100 research nurses into 2 groups of 50, on group had Maynard’s every day whilst the other group had the placebo.  Neither the participants or study staff knew the allocation.  The Maynard group recruited 12% more patients to studies over a 6 month period. 

(Randomised control trials)  RCTs randomly assign participants to either the treatment or placebo group.  Blinding is usually involved.  These trials are expensive and can't prove causation.

  • We report our study to determine the optimum sweets for research nurse productivity.  We performed a literature review and critically appraised 200 randomised controlled studies of sweets and research nurse productivity.  We find that that Maynard’s wine gums are the superior sweet for research nurse productivity.  

(Systematic review) These involve an exhaustive review of the current literature. They take less time than a new study and results can be extrapolated into general population more broadly than other studies.  However. they are very time consuming and researchers may not be able to combine some studies.

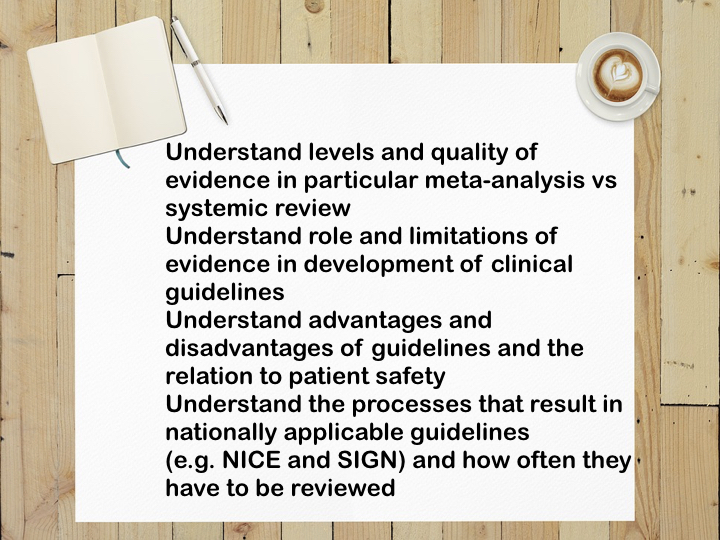
There was then a discussion about systematic reviews and meta-analysis. Systematic reviews are a type of literature review that use systematic methods to collect secondary data and critically appraise research studies to create an exhaustive summary of current evidence.  Meta-analyses assumes a common truth between a variety of different studies.  They use statistical methods to find a pooled estimate close to the common truth.  This led to The Cochrane and how they perform systematic reviews.  

The session then looked at how guidelines are formed using the example of NICE and their own protocol for producing clinical guidelines.  They broadly follow these steps:

  1. Choose a topic
  2. Produce the scope
  3. Develop a guideline using a literature review and considering costings
  4. Consult and revise the guidelines
  5. Sign-off and publish
  6. Update

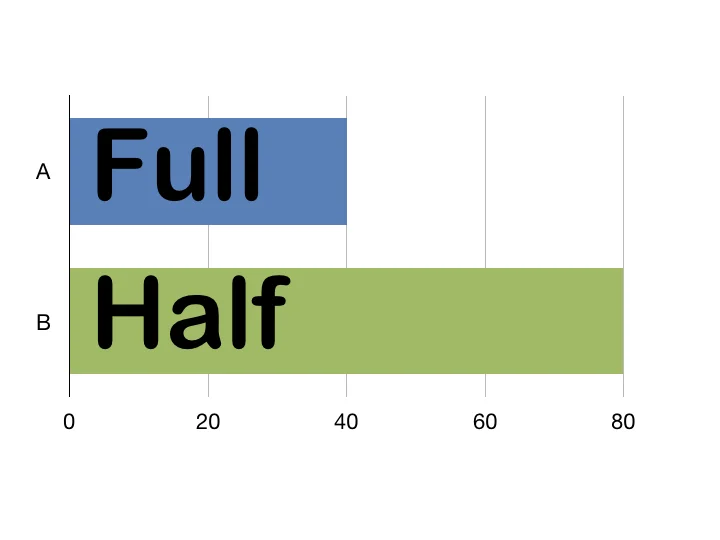
There was a brief discussion about the limits of guidelines using the FeverPAIN Score as an example before looking at how the cost effectiveness of a treatment is used through 'Quality Adjusted Life Years' or QALYs.  QALY is measured on a scale from 0 (death) to 1 (perfect health).  A year of perfect health is 1 QALY.  Health is calculated using the EQ-5D model which has five dimensions (mobility, self-caring, activities of daily living, absence of pain/discomfort and absence of anxiety/depression.  Time is then factored in to make a QALY.  This means 2 years of half perfect health would be 1 QALY as would 4 years of 0.25 perfect health and so on. 

We then ended with an activity attempting to create guidelines for the fictional disease 'Maynard's disease'. 

You are a committee formed by NUH NHS Trust to create guidelines to protect our research nurses against Maynard’s disease

Maynard’s disease is an acquired condition effecting research nurses who do not get enough wine gums.  However, wine gums are expensive and contain a lot of sugar.  You want to create UK guidelines for the right number of wine gums needed to prevent Maynard’s disease whilst not causing harm to your nurses.  

Look at the evidence below and create your guidelines.  Be ready to explain your choice

Would you want to do any studies yourself to fill any holes in the evidence?

(There isn’t a right answer here, it’s just the process (and maybe debate))

  • A systematic review of RCTs in Japan recommended 5 wine gums a day reducing Maynard’s disease by 65% with a 10% rate of diabetes
  • A research unit in Leicester gave their nurses 10 wine gums a day for a year.  None of them have developed Maynard’s disease or diabetes
  • A single blind randomised control trial in the UK found that 2 wine gums a day reduced Maynard’s by 50% with a 2% rate of diabetes
  • A double-blind randomised control trial in the UK found that 3 wine gums a day reduced Maynards by 60% with a 5% rate of diabetes
  • A research unit in London has looked back at all their nurses employed in the past 15 years.  Their  nurses who developed Maynard’s disease ate on average 2 wine gums a day or fewer.  No nurse who ate 4 or more wine gums a day developed Maynard’s.  Their nurses who developed diabetes and obesity ate on average 5 or more wine gums a day.  None of their nurses who ate 2 or fewer wine gums a day developed diabetes
  • A 60 year old research nurse in Scotland has never eaten a single wine gum and has never developed Maynard’s disease.  She does have diabetes though
  • A meta-analysis of RCTs in the USA recommended 4 wine gums a day to reduced Maynard’s disease by 60% with a 15% rate of diabetes
  • A study in France compared research nurses with Maynard’s with research nurses without Maynard’s and found that the nurses without Maynard’s ate on average 2 wine gums a day.  
  • A study in Germany compared research nurses with diabetes and research nurses without diabetes and found that the nurses with diabetes ate on average 3 wine gums a day
  • A multi-centre double blind RCT in Europe has found that 2 or more wine gums a day offer no benefit against Maynard’s disease for nurses over 35 but increases the risk of diabetes by 1%

Session Four: Types of trial

This episode is a live recording of the fourth session of #UnblindingResearch held in DREEAM 16th May 2018.  The group work has been removed for the sake of brevity.  

This session of #UnblindingResearch looks at the different types of research trial and how our outcome decides the type of trial used.  Here are the slides for this session (p cubed of course), you can move between slides by clicking on the side of the picture or using the arrow keys.

The session began looking back on our previous sessions, first the introduction to the research method, then how we formulate a research question using PICO (Research, THE search, WE search) as well as get funding and then the last session covering the 'tale of two cities' of good clinical practice and ethics (the only way is ethics). 

This session looked to prove that research doesn't have to be a trial, it can be sweet!  There was lots of group work based on scenarios with research nurses and sweets* to explore the different types of trial:

Research nurses like sweets. You want to see the impact of eating sweets on the dental health of new research nurses.  (LONGITUDINAL)

Longitudinal trials are an observational method with data collected over time.  They can be retrospective or prospective.  This obviously takes time and you can imagine nurses leaving the department or taking time off for illness/pregnancy and so being lost to follow up.  This is a large problem for longitudinal studies.  

You want to investigate the dental health of nurses across different departments within the trust and the factors behind it.  (COHORT)

Cohort studies are a particular type of longitudinal study.  A cohort is a group of people who share a particular characteristic. They observe large groups of individuals, recording their exposure to certain risk factors to find clues as to possible causes of disease. They can be retrospective or prospective.  

You believe that changing research nurses’ snacks to fruit rather than their usual sweets will improve their dental health. (INTERVENTIONAL)

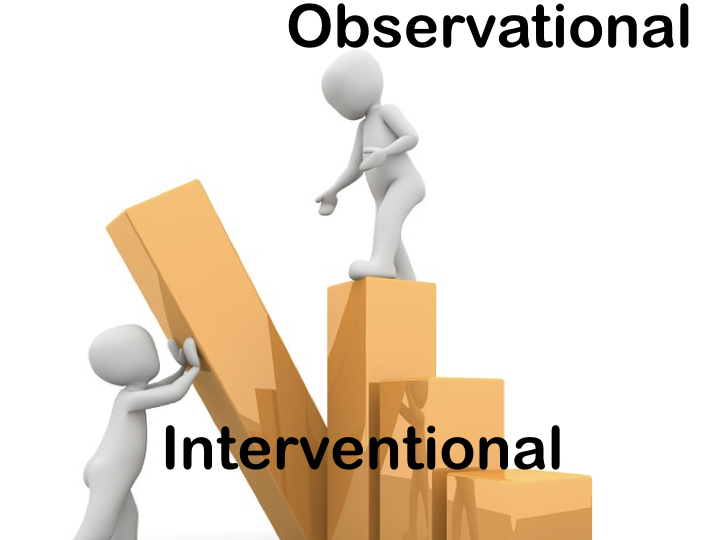
Observational studies have no controls over variables they simply observe.  Interventional studies change one variable and compare or use a control.  

You want to know about the snack choices of research nurses in a department and what influences them. (CASE STUDY)

Case studies are very deep in analysis but narrow in breadth.  They involve a very close and detailed analysis of a particular concept such as the decision making of a small number of individuals.  It is not the same as a case report.

Professor Haribo has published a new diagnostic test to tell nurses how likely they are to get obese from eating sweets.  It is believed that it could predict if a nurse should eat sweets by scoring if a nurse will get obese or if they won’t.  Traditionally we have used diet plans to predict obesity from eating sweets. You want to investigate the new test. (DIAGNOSTIC ACCURACY TEST)

Diagnostic accuracy tests are all about how a test correctly identifies or rules out a particular disease and how this can inform subsequent decisions.  A test needs to correctly identify a disease in those who have it (true positive) which is its sensitivity and correctly rule it out in those who don't have it (true negative) which is its specificity.  If we are evaluating a new test this is known as the index test and it is compared against the reference standard.  The D Dimer in PE is a classic example of a test with high sensitivity but low specificity and how we need to know this during clinical decision making.  Here is a good article from the BMJ on diagnostic accuracy studies.  We will look more at sensitivity and specificity in future sessions.  

You have a theory that Tesco own brand wine gums will improve research nurse productivity compared to Maynard wine gums.  You know that research nurses like Maynard’s wine gums** and so want to design a study to get over this bias.  (RANDOMISED CONTROL TRIAL)

RCTs are the gold standard of research trial.  It is designed through random allocation of participants to receive the new treatment or to receive standard treatment/placebo to overcome inherent biases.  We discussed ways of randomising and blinding and the limitations of this.  
For instance it would be easy to be blinded about these two syringes as to which one contains the real medicine and which one contains the placebo as they look the same and can be delivered without the doctor or nurse knowing which is which: 

IMG_0126.jpg

However as with our sweets if there is a difference in appearance, smells or taste however then true blinding is much more difficult and we may need unblinded research staff.  

*These scenarios were written by Lucy Ryan the DREEAM Research team manager and she openly admits to loving sweets

** We at DREEAM have nothing against non-Maynard wine gums we just prefer those from Maynard.  We have no financial involvement in Maynard but would be willing to listen to any offer of free sweets

Session Three: Good Clinical Practice & Ethics

We started the session by revising the 'PICO' format of research analysis on some specially made abstracts based on some infamous cases of poor medical ethics; Tuskegee, the Guatemalan Syphilis Experiment and Skid Row Cancer Study:

Tuskegee Study of Untreated Syphilis in the Negro Male

Syphilis is an important sexually transmitted disease with multiple stages along its natural history.  Little is known about the right time to begin treatment for syphilis and at which stage of the disease’s progression and with which dose.  It has been theorised that syphilis affects different ethnic groups.  We observed 622 poor African-American sharecroppers.  431 had syphilis at the time of enrolment.  Participants were given free medical care, meals and burial insurance for participating.  Participants were informed that the study would last 6 months but it continued for 40 years.  After a decade the advent of penicillin showed a treatment for syphilis.  No participant was treated and observation continued.  No participant was informed they had syphilis.  By the end of our study 28 participants died of syphilis, 100 were dead of related complications, 40 of their wives had been infected, and 19 of their children were born with congenital syphilis. 

Guatemala Syphilis Experiment

Syphilis is an important sexually transmitted disease with multiple stages along its natural history. Traditional treatment options for syphilis have been shown to have mixed results.  Penicillin has emerged as a possible treatment for syphilis.  We recruited 1,038 Guatemalans to our study from the army, prisons and mental institutions.  Participants were unknowingly infected with syphilis through inoculation or through exposure with prostitutes infected with syphilis.  52% (678) participants received a form of treatment; penicillin, placebo or traditional treatment. The age range of treated patients was 10-72.  Overall 82 participants died.  

Skid Row Cancer Study

There is limited knowledge regarding the treatment of prostate cancer or the training for rectal exams.  It has proven hard to recruit patients to trials due to concerns over pain and other adverse effects.  We recruited homeless men in Lower Manhatten showing signs and symptoms of urinary obstruction.  Little was known of their background although many had alcohol or mental health problems.  Patients underwent a physical examination as well as blood and radiological investigations.  Biopsies of the prostate were taken.  If cancer was confirmed a prostectomy and orchidectomy was performed and hormone treatment commenced.  Patients found to have cancer received a bed, 3 meals a day and free medical treatment.  To ensure recruitment we did not inform the patients of adverse events following biopsy.   24 patients reported adverse events following biopsy.  Of 686 patients tested, the mortality rate for patients with negative biopsies was 20% whilst it was 30% in patients with positive biopsies receiving our rigorous treatment. 

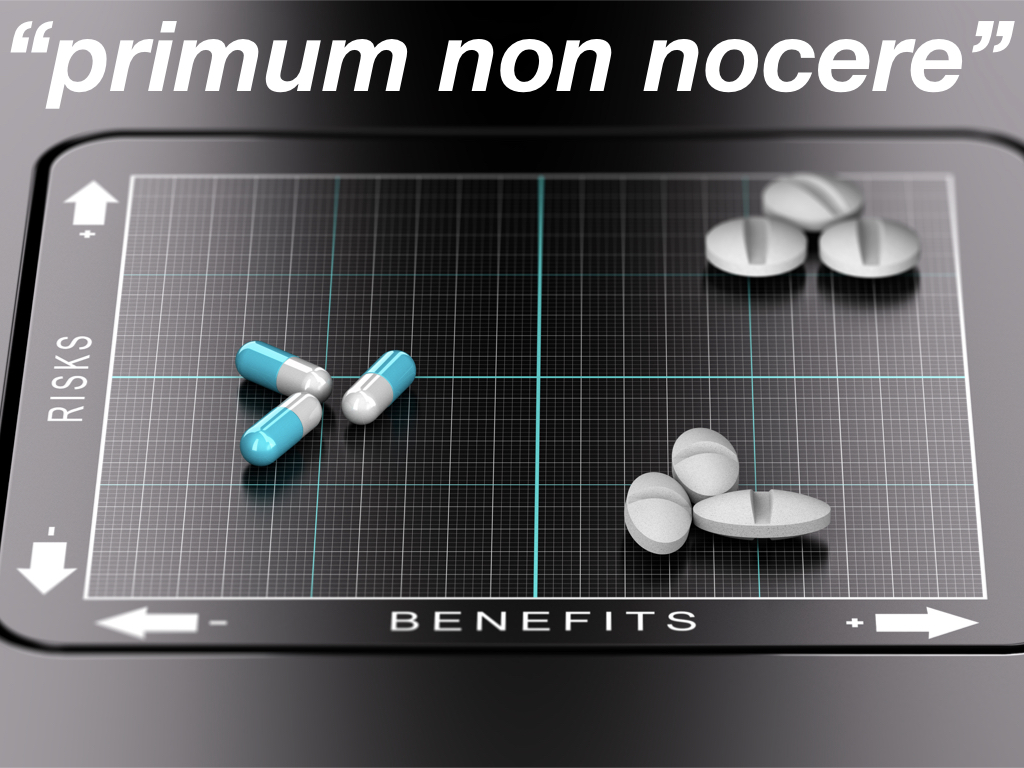
We then moved on to discuss what ethics actually are (moral principles guiding an individual or an activity) and how they are both personal and official.  Medical ethics date back from the Hippocratic Oath in the 5th century BC and 'prinum non nocere'.

The next section 'A Tale of Two Cities' looks at Nuremberg 1947 and Helsinki 1964 which codify ethical principles in clinical research.  

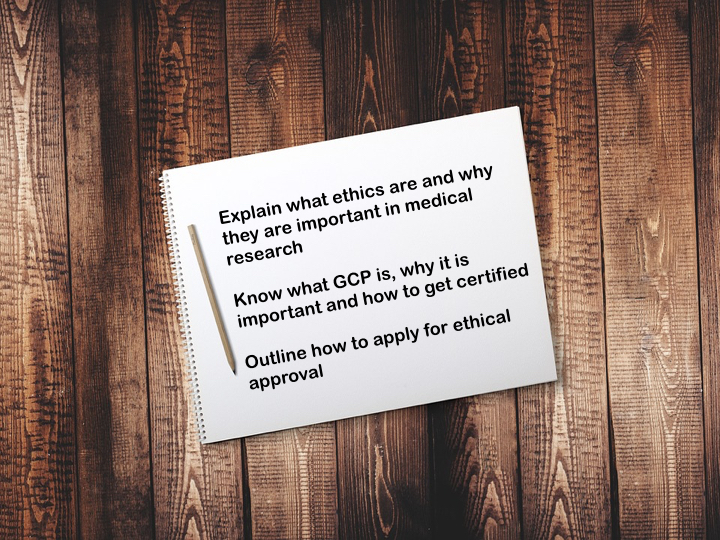
We then had a look at a current patient information sheet and consent form before looking at how we can get ethical approval for our studies.  If our study involves NHS staff, patients or premises then we need approval from the Health Research Authority.  Their website has a tool for checking if your study counts as research and needs approval and then details how to go about getting approval.

We also mention Good Clinical Practice - the international ethical, scientific and practical standard for how clinical practice must be conducted.  More information can be found on the National Institute for Health Research website who offer both introduction and refresher courses.

Remember the next session:

Types of trial 16th May. 

Session Two: Formulating research questions and designing a project

This episode is a live recording of the second session of #UnblindingResearch held in DREEAM 21st March 2018.  The group work has been removed for the sake of brevity.  Here are the slides for this session (p cubed of course), you can move between slides by clicking on the side of the picture or using the arrow keys.

Research. THE search.  WE search.

This talk focuses on the 'PICO' model:

Population and Problem

Intervention

Control/Comparison

Outcome

This model is useful for your literature search (P+I) and all together (P+I+C+O) makes up your research question.  It can also be used to interpret a paper you're reading.  Also mentioned are sources of funding and support including:

Research Design Service

National Institute of Health Research 

Outcomes and methodology are touched on; this is will be further explored in later sessions.

Remember the next session:

GCP and Ethics 18th April. 

Session One: Introduction to audit, quality improvement and research

This episode is a live recording of the first session of #UnblindingResearch held in DREEAM 21st February 2018.  The group work parts have been removed for brevity sake.  Here are the slides for this session (p cubed of course), you can move between slides by clicking on the side of the picture or using the arrow keys.

The group work involved sorting a few terms under the headings of Audit, Quality Improvement and Research.

The clinical research approach is briefly covered, discussing literature searches and how primary outcomes might affect the methodology as well as what secondary outcomes are.  Audit is discussed with emphasis on the cyclical approach.  Finally Quality Improvement Projects are covered, how they are linked to audit, the PDSA format (Plan, Do, Study, Act) and how it can be embedded across healthcare.  

Here is the link mentioned to more information on QIPs from the NHS.

Here is the BMJ article mentioned covering how to set up an audit.  

Don't forget the next session: 'Formulating research questions and designing a project' is in DREEAM on 21st March 2018 with the podcast being released shortly after.